Want to use your survey responses in business strategies and present survey results in a report? Quiz and Survey Master is a great WordPress survey plugin that helps you in creating amazing surveys for your website. It has a user-friendly interface which makes it easy for people to use it even without the knowledge of coding.
If you put results into a graph or display survey results in excel, it becomes much easier for you to analyze them. It helps you in subjectifying your target customers and marketing strategies.
In this blog, we will show you how to present survey results in a report and why is survey important.
Why Do You Need a Survey?

1. Faster
The time needed for an online survey is much less than the time requires for a manual survey with a paper questionnaire. Response time is almost instant as you don’t have to wait for people to come back and submit their responses.
2. Accuracy
The margin of error significantly reduces for online surveys as every response is submitted online. In the manual way of survey, you have to be dependent on the people to first collect the information on paper and then list them online. This might increase the chances of errors.
3. Easy to style
With an online survey, it becomes much easier for brands to make an impression of their business in users’ minds. You can design surveys as per the gadget like a laptop, phone, or tablet.
Tip: Quiz and Survey Master offers you various premium themes that can make your survey looks beautiful. It helps you in creating your brand identity. Buy QSM Premium Themes.
4. Increase engagement
Surveys are a great way to increase customer engagement. You can strengthen relations with your customers and can start a conversation. With a good survey, you can know your customers’ expectations.
5. Customer database
You can collect customers’ information like names, phone numbers, and email, and can know about their personal choices. You can use that information for future marketing and a better understanding of your audience.
How to Present Survey Results?

Firstly, add Quiz and Survey Master to your WordPress site and create a survey. Read How to Create a Survey in WordPress (Step by Step). Add Reporting and Analysis addon to your WordPress site. Purchase QSM Bundle to get a Reporting and Analysis addon.
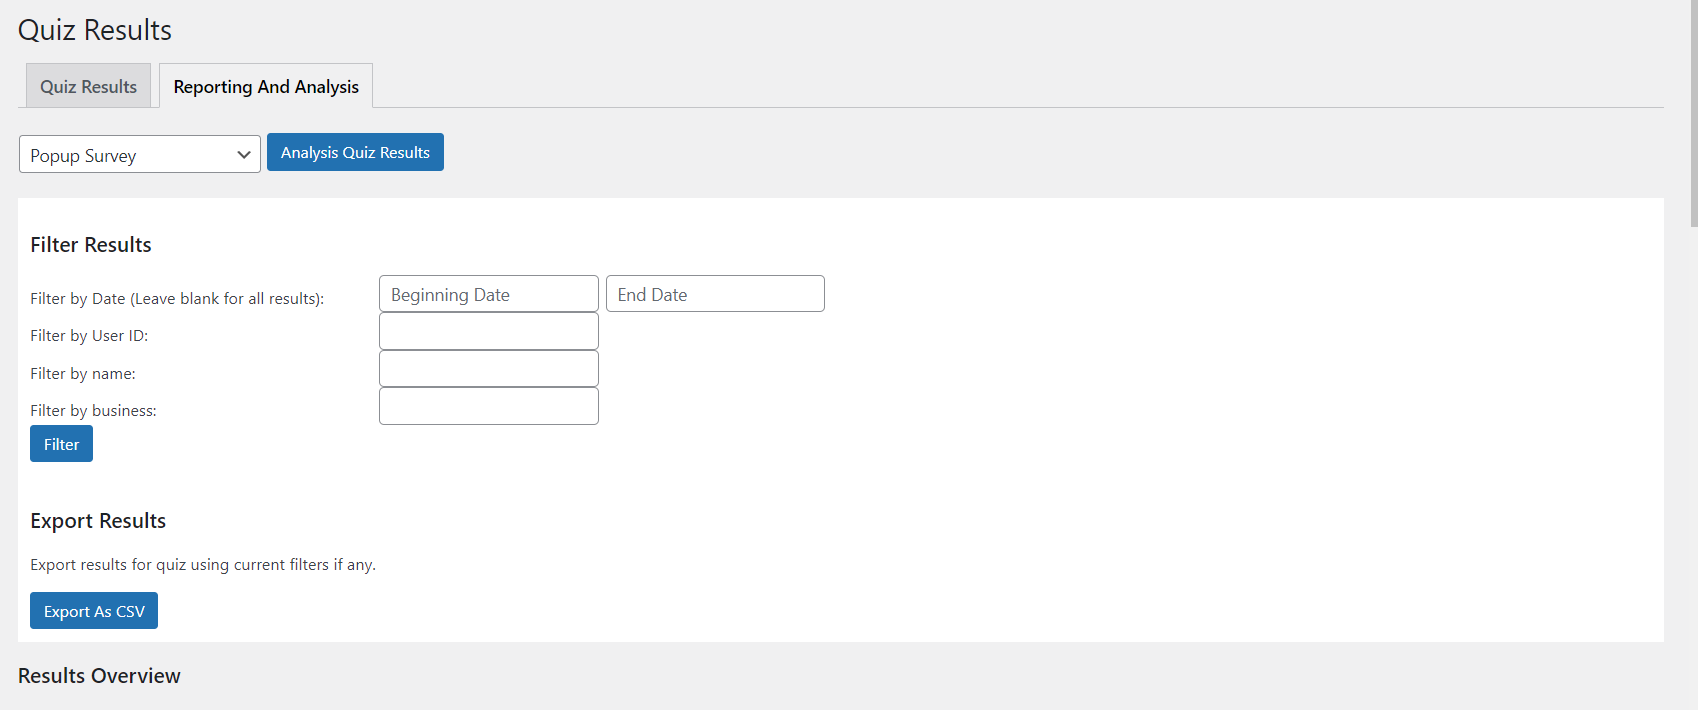
Now, to present survey results, go to the Results Page and navigate Reporting and Analysis tab. Select the quiz/survey on which you want a report. Next, click on “Analyze Quiz Results”.

Next, you will see various options to filter your results. You get options to filter your results by date, user ID, name, and business. You can export your results as a CSV file. It can be imported to a variety of spreadsheet software like Excel and Google Sheets.
With filters, you can export only data in a certain time frame, by a certain user, by a certain name, or by a certain business. The export feature can be used with or without the filter.
You can see the results overview in the “Results Overview” field. It includes the total number of submissions, average points, and average score.
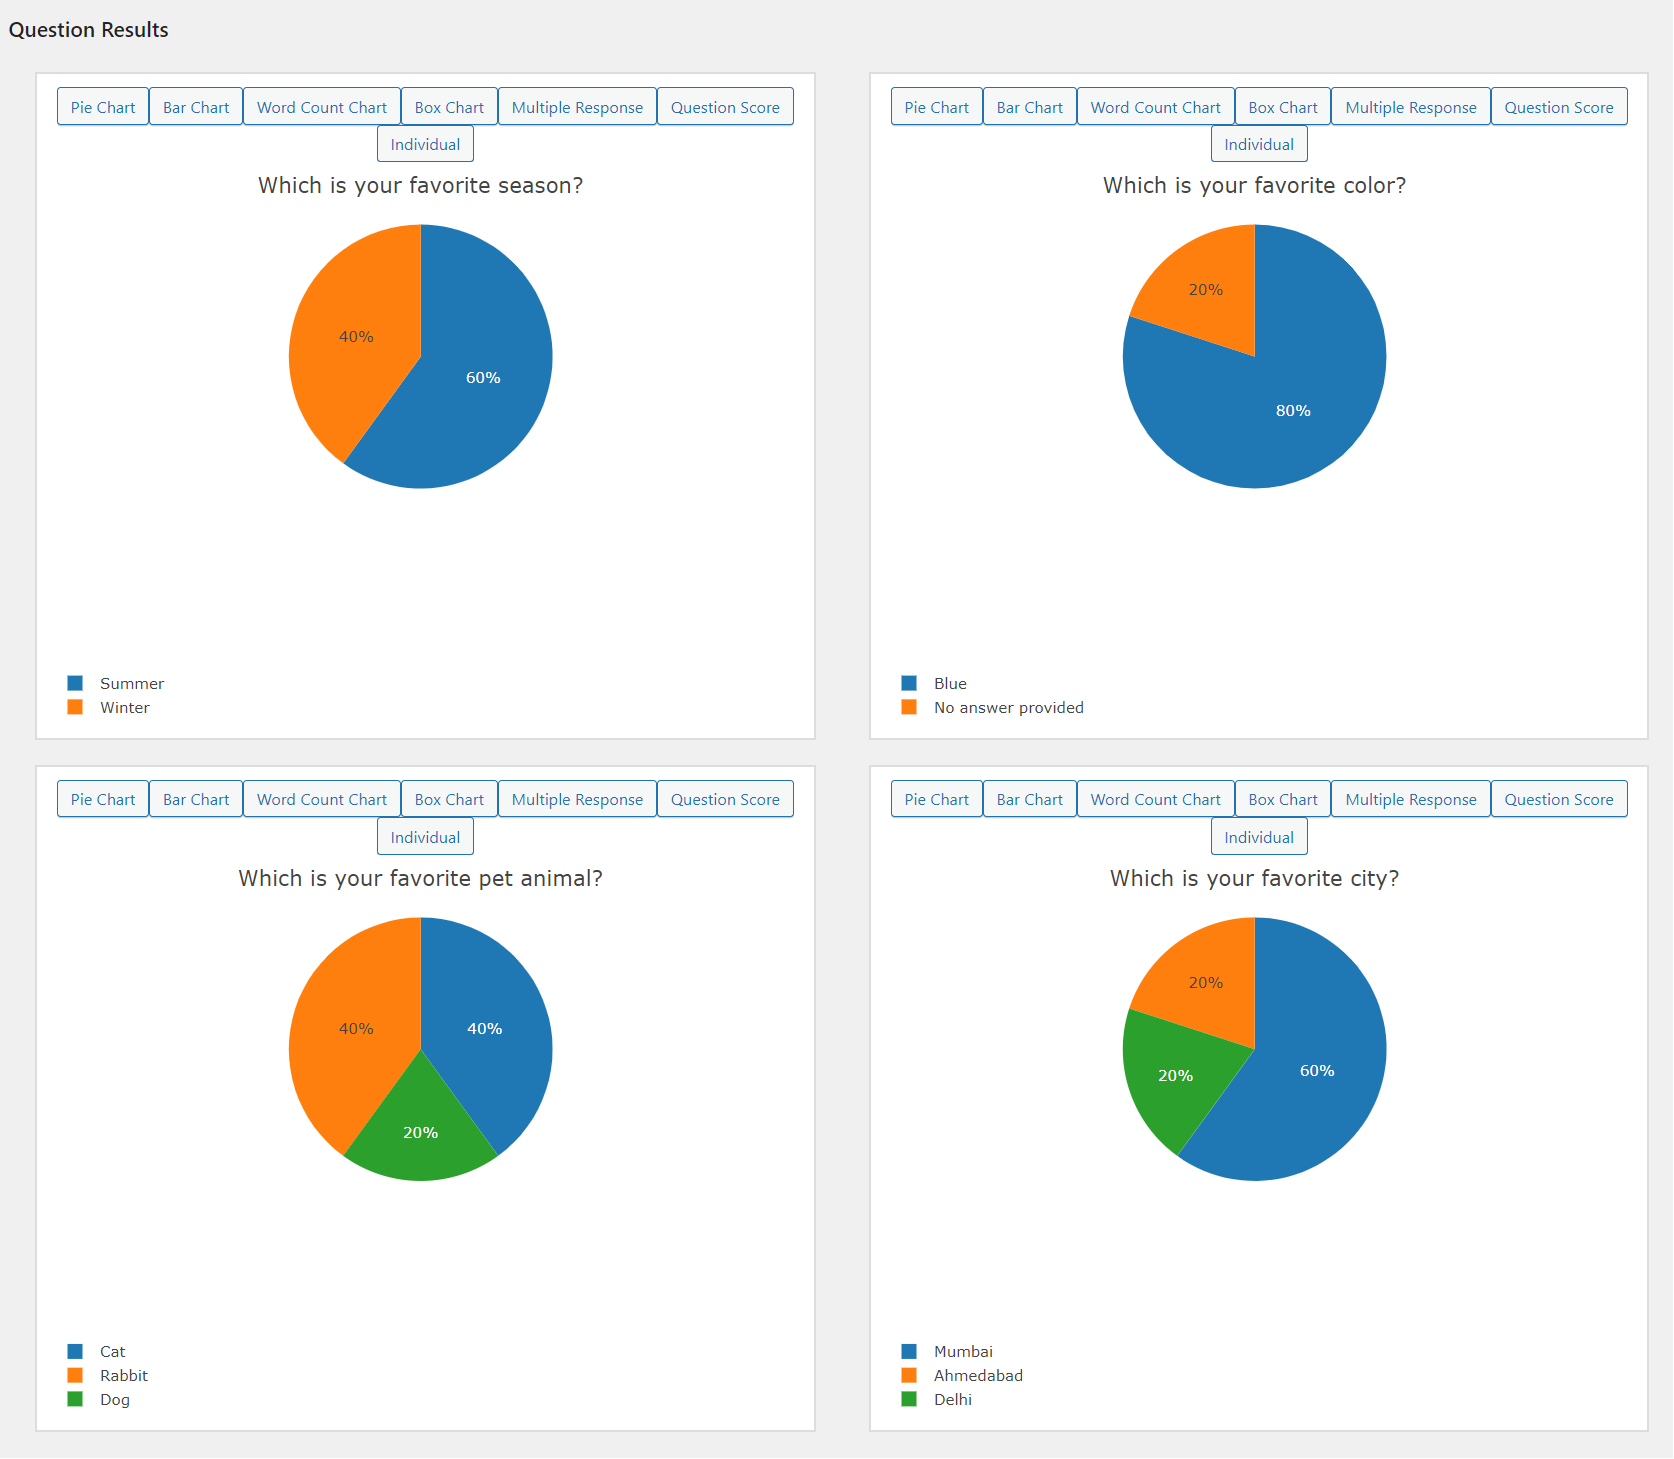
In the Questions Results, you can present survey results in the following form,
- Pie Chart
- Bar Chart
- Word Count Chart
- Box Chart
- Multiple Response
- Question Score
- Individual

You can export the graph as a PNG image, by clicking on the camera icon on the top-right corner of the box.
If you have a multiple-choice survey and want to present survey results to your users with the pie chart result on the result page, use shortcode “%QSM_PIECHART_RESULT_QUESTION_ID%” on the results page. Replace QUESTION_ID with the survey question id and save changes.
Why use Reporting & Analysis Addon?
QSM’s reporting and analysis addon provide you with various charts, graphs, and filters to help you analyze your quiz/survey results. You can even export this data for further analysis.
Get this amazing addon and better your quiz reports.
Top Features
- Generate Reports in Clear Visual Charts
- Filter results by date, id, name, etc.
- View Results overview with Average Points & Score
- Export Results in a CSV File
Free Addon: Certificate
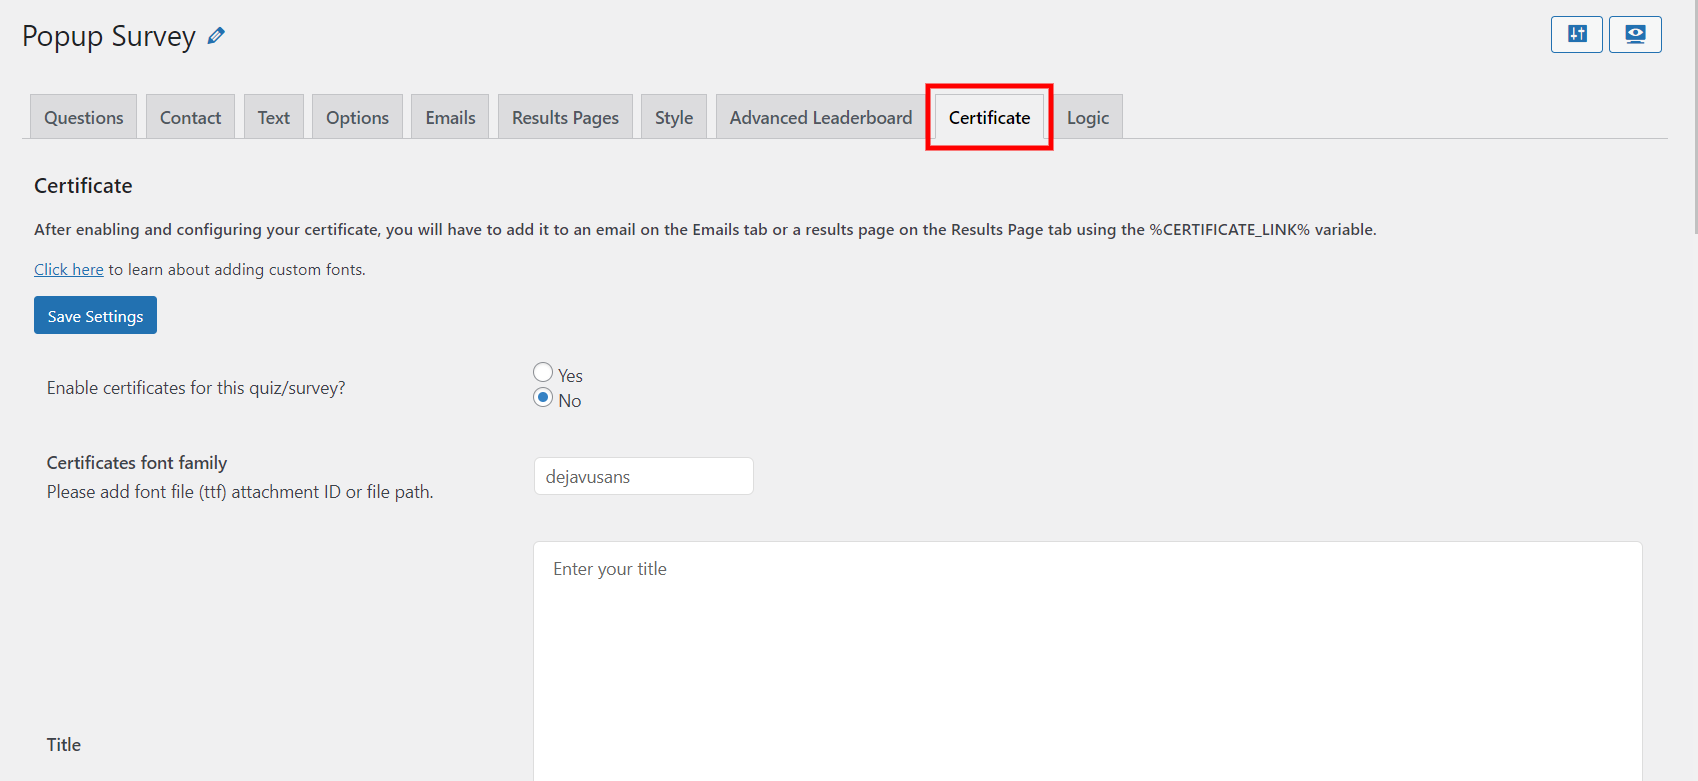
If you want to present your users with a certificate, Quiz and Survey Master has a free add-on for that. Download the Certificate addon to your WordPress site to send certificates to your users for taking surveys. You can customize it with users’ names, logos, results, background images, and much more.

Related: How to Create a Customer Satisfaction Survey in WordPress (4 Easy Steps) – Quiz And Survey Master
FAQs
What is the best way to present data from a survey?
The best way to present data from a survey can be using charts, graphs, or tables. Using the Reporting and Analysis addon by QSM, you can present survey results in bar graphs, pie graphs, and more in just one click!
What do you do with survey results?
Survey results are crucial for researchers. Once your survey results are collected, you may want to organize and interpret that data into information. You can do so by presenting survey results in the form of infographics, graphs, videos and etc.
How do you present survey results to executives?
It is only natural to create organized infographics like bar graphs, pie charts, and Venn diagrams to present survey results to executives. You should be clear about your agenda and acknowledge your audience. Using visual data always makes presenting survey results easier and more fun!
Conclusion
We hope this blog about how to present survey results has helped in some way or the other. There are various ways to present survey results you can display survey results graphically or word count charts or box charts.
WordPress survey plugin- Quiz and Survey Master can take your surveys to a whole new level. It has various options to optimize your surveys. Consider trying QSM Pro Bundle which has various add-ons to help you make amazing surveys.


