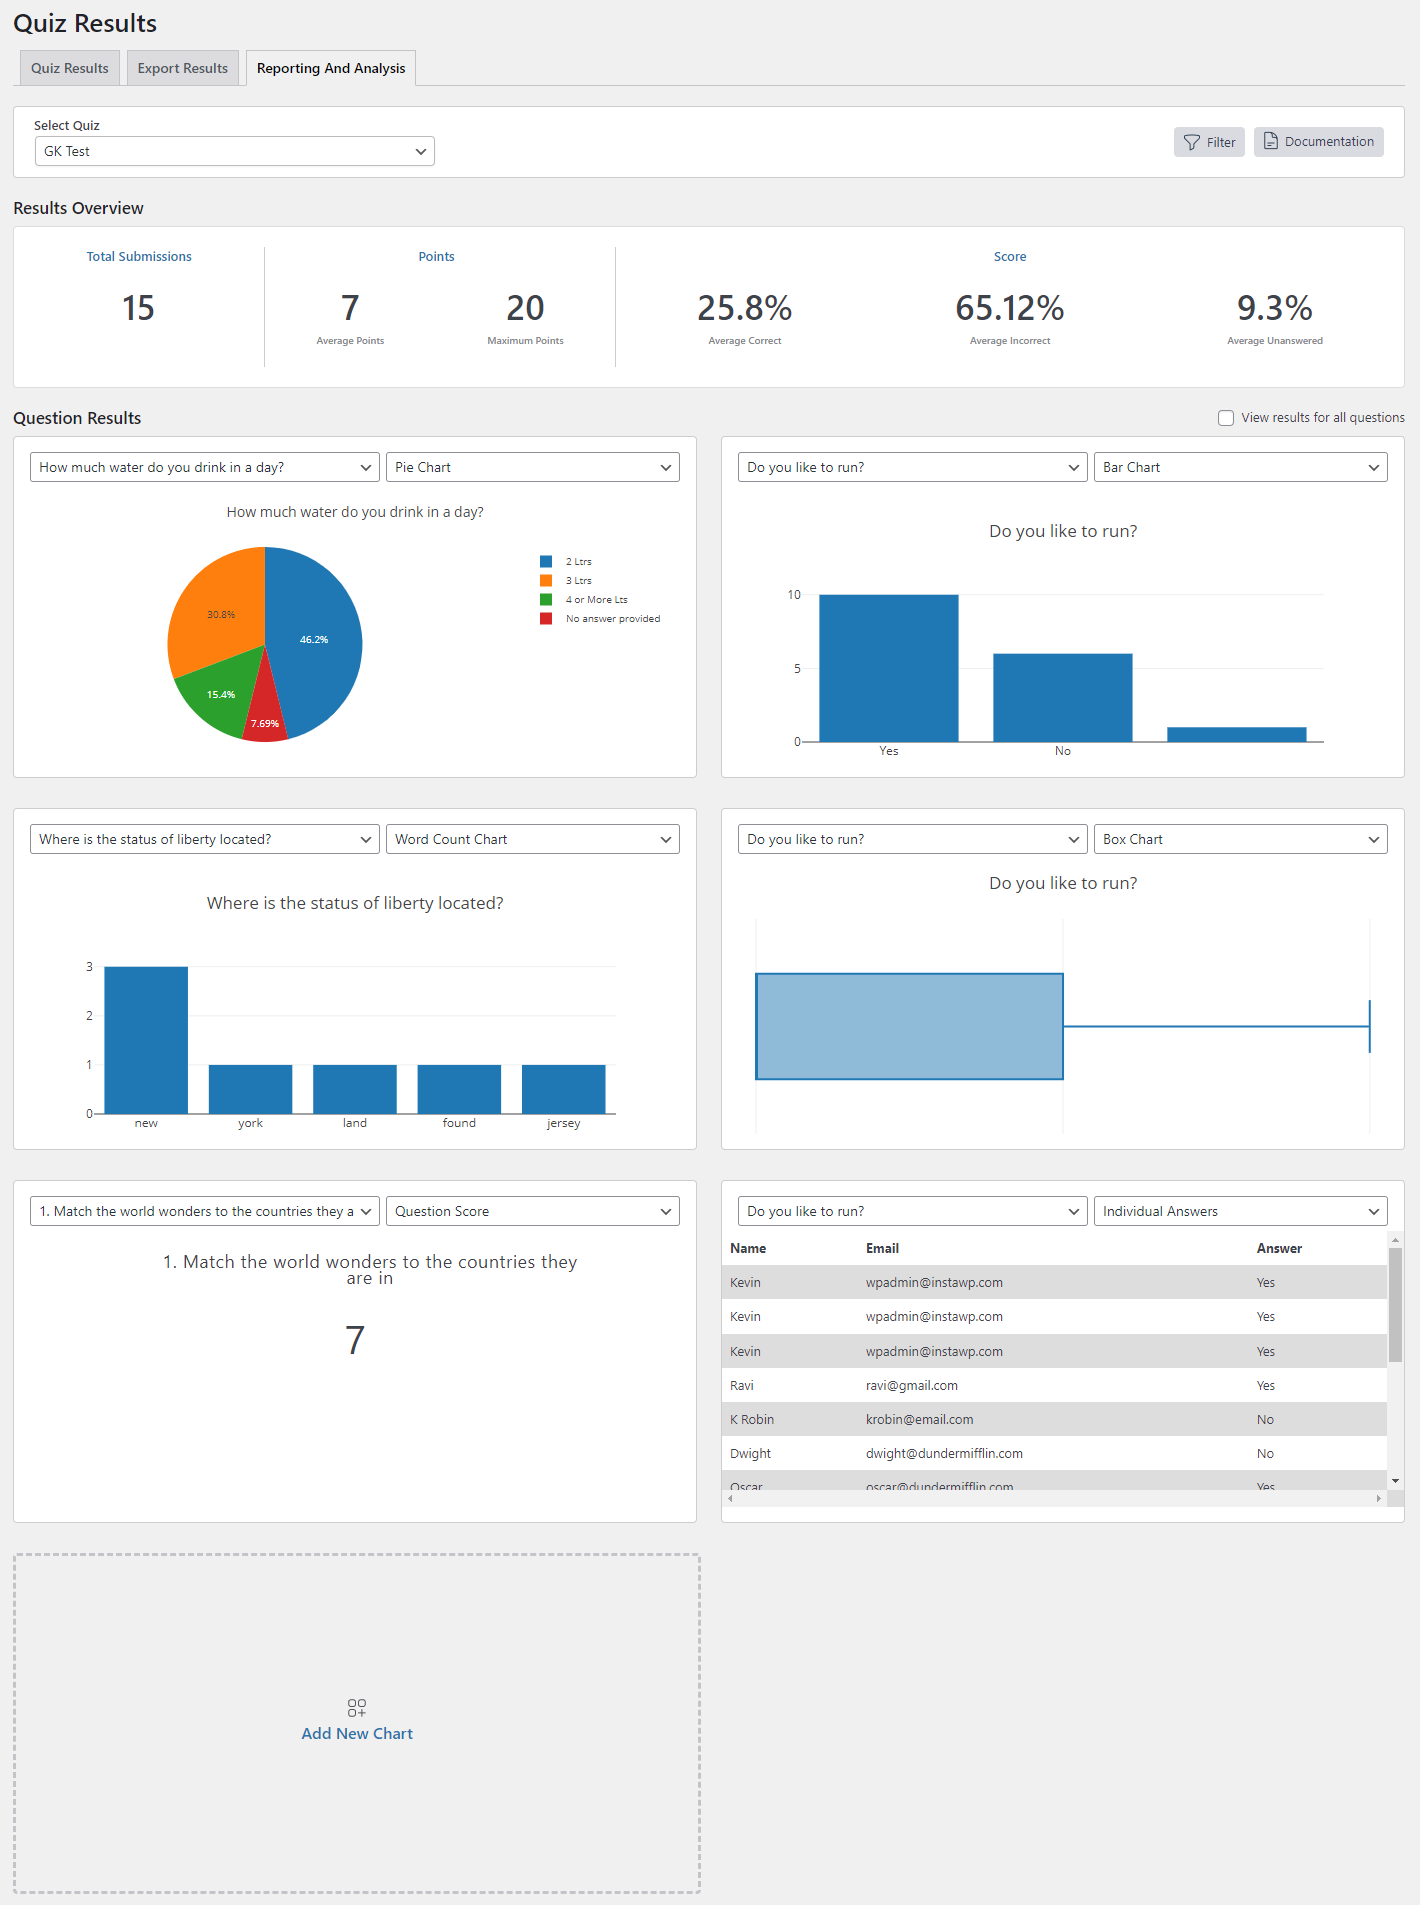
Efficiently analyze and visualize your quiz and survey data with our powerful add-on, providing valuable insights to assess your audience’s responses and make data-driven decisions.
This add-on boasts impressive reporting and analysis capabilities with flexible filtering options. Use four different chart types and three plotting methods to visualize the data. Enhance the experience by creating custom charts for each question result.
Key Features
- Setup Custom Dashboard for each Quiz/Survey
- Detailed Analysis like Number of Submissions, Points/Score
- Filter Data by Date, User Name, and Category
- Graphical representation with Multiple Chart Types and Plotting Methods
Visualize Data with Charts
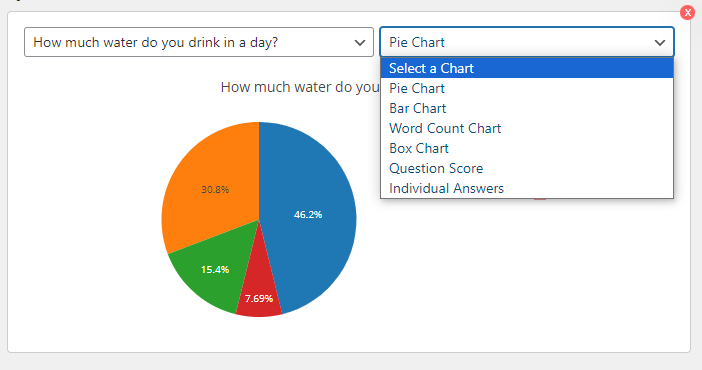
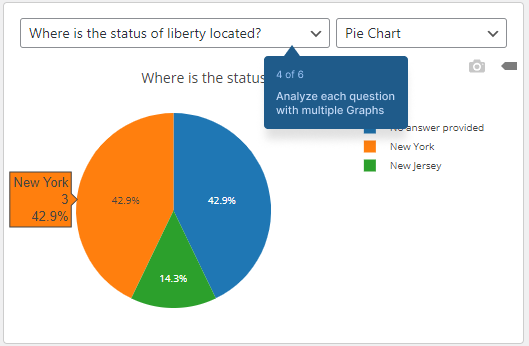
Present your collected quiz data in a visually appealing format using a variety of charts including
- Pie Charts
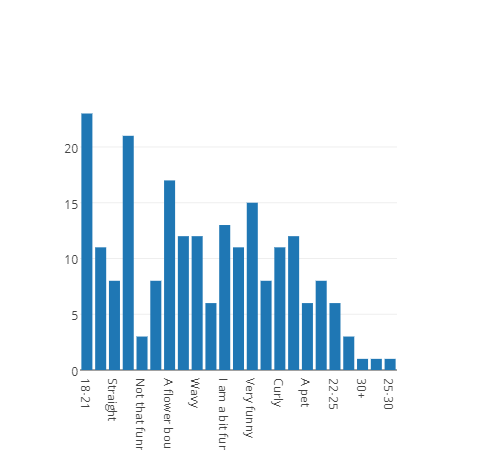
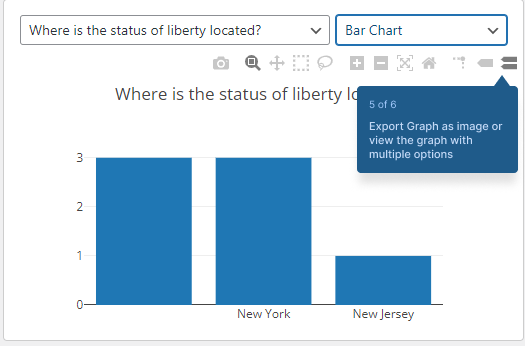
- Bar Charts
- Word Count Charts
- Box Plot Charts
- Question Score
- Individual Answers
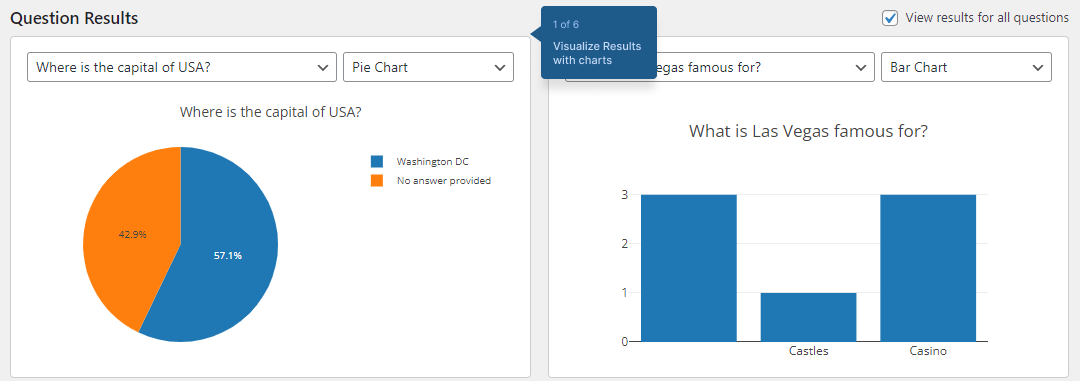
These charts provide a clear and concise way for you to comprehend your data quickly.
Flexible Filtering Options
Filter the quiz data and get the maximum output
- Date Ranges – Filter quiz data by a Start and End Date
- User Names – Filter data by username
- Question Categories – Filter data by question categories

Filter out what data you actually need and discard the rest, making optimal use of the generated reports.
Results Overview
Get a summary of your quiz or survey results, and understand at a glance how the responders performed overall with points and score metrics.
- The total number of submissions
- Average points earned
- Average score

This gives you a quick snapshot of the overall performance.
Graphical Analysis
Explore detailed graphs for each question, allowing you to identify areas where users struggled or performed poorly. Analyze individual scores and assess open-answer responses to gain deeper insights.
Download Graphs
Download Graphs to your system & Display graphs on the results page to the quiz taker your graphs as PNG image files for easy sharing and integration into presentations, documents, or reports. This allows you to communicate your findings effectively.
Display Graphs
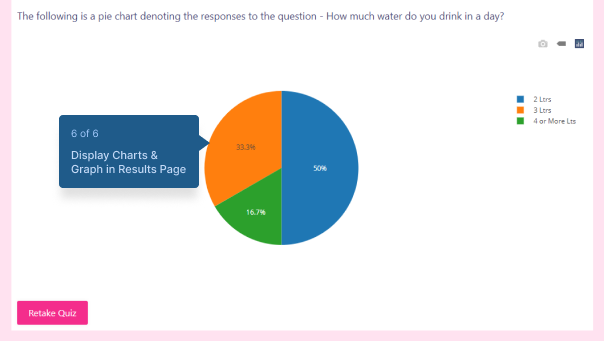
Display bar and pie charts for a particular question or question category on the results page for improved analysis. This way the respondents can also see the overall response data for a particular question or a quiz.
Popular Use Cases
- Market Research: Gather data on consumer preferences and behavior to inform business strategies.
- Employee Training and Development: Assess employee knowledge and identify training needs.
- Educational Assessments: Evaluate student understanding and progress to tailor instruction.
- Customer Satisfaction: Collect feedback to enhance products and services.
- Event Planning: Gather feedback to improve event experiences and plan future events.
License Terms & Documentation
The add-on includes one year of support and updates. Access the license terms and documentation for more details.
- View license terms
- View Reporting and Analysis Documentation
- Watch Reporting & Analysis Addon in Action

